我国持续性重大天气异常成因与预报方法研究回顾与未来展望
 , 倪允琪, 陈阳
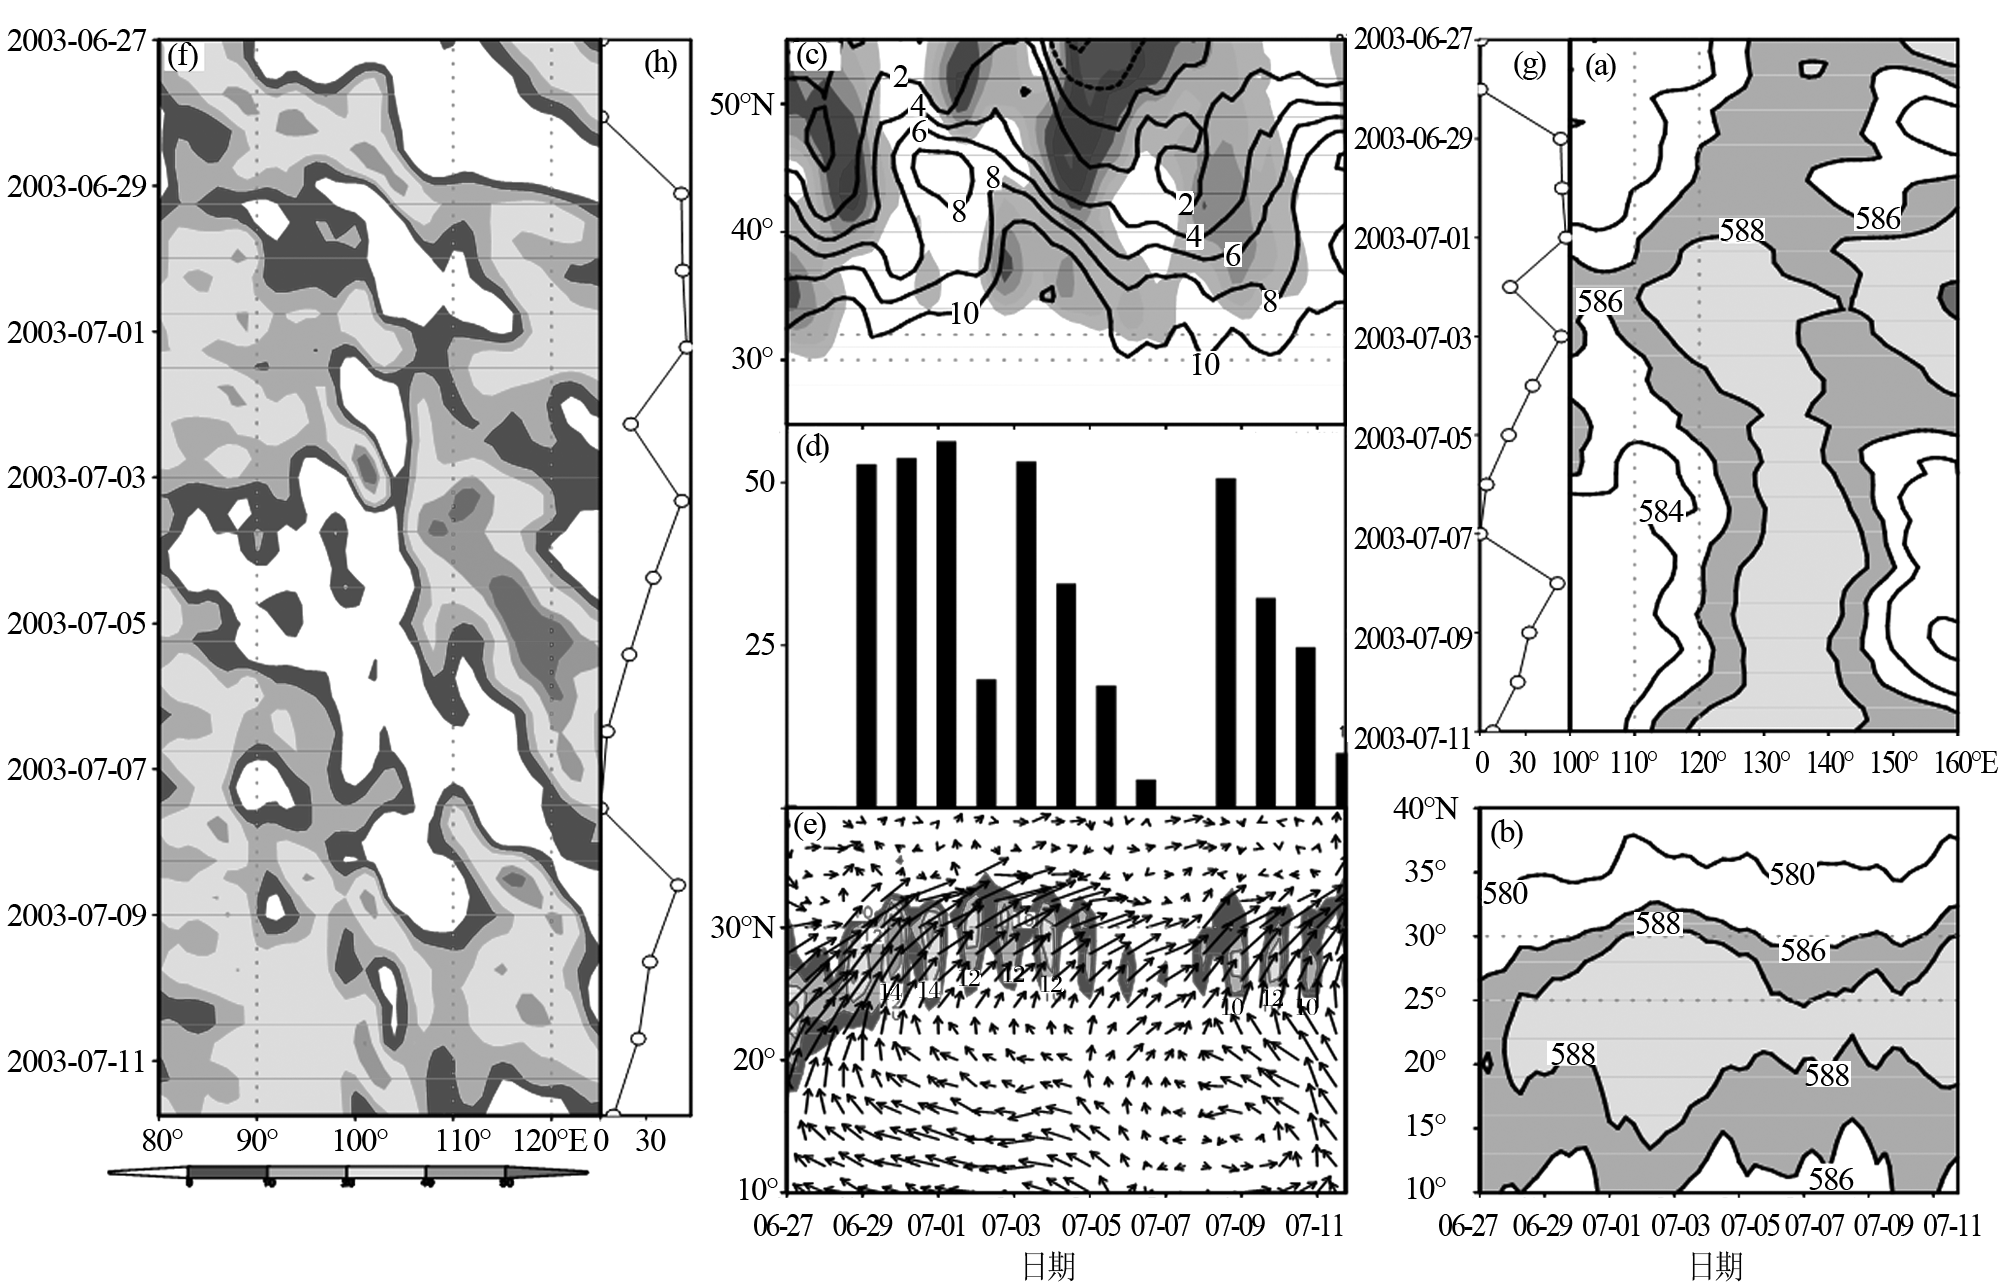
 Mechanism and forecasting method of persistent extreme weather events: review and prospect
Zhai Panmao, Ni Yunqi, Chen Yang
, Ni Yunqi, Chen Yang Fig.3 The synoptic model for the floodingcausing heavy precipitation in Huai River during 2003.06.27-2013.07.11 aand b Denote longitudetime 27.5#cod#x000b0;~32.5#cod#x000b0;N and latitudetime 110#cod#x000b0;~130#cod#x000b0;E plot of geopotential height at 500 hPa unit: 10 gpm; cDisplays the latitudetime 110#cod#x000b0;~120#cod#x000b0;E plot of meridional wind and temperature at 700 hPa, with contour interval 2 ℃, the shadings indicates the northerlies; d,gand f Represent the daily precipitation unit:mm of Huai River 32#cod#x000b0;~34#cod#x000b0;N,115#cod#x000b0;~120#cod#x000b0;E; e Shows the evolution of the monsoon flux110#cod#x000b0;~120#cod#x000b0;E, with arrows indicating the verticallyintegrated water vapor flux from ground to 300 hPa unit: kgm#cod#x000b7;s,the shadings denote that the wind speed is greater than 12 ms; f Shows the longitudetime 32#cod#x000b0;~34#cod#x000b0;N plot of vorticity at 600 hPa, with shadings indicating positive vorticities unit: 10 -5 s -1 [ 50 ]