我国持续性重大天气异常成因与预报方法研究回顾与未来展望
 , 倪允琪, 陈阳
 Mechanism and forecasting method of persistent extreme weather events: review and prospect
Zhai Panmao, Ni Yunqi, Chen Yang
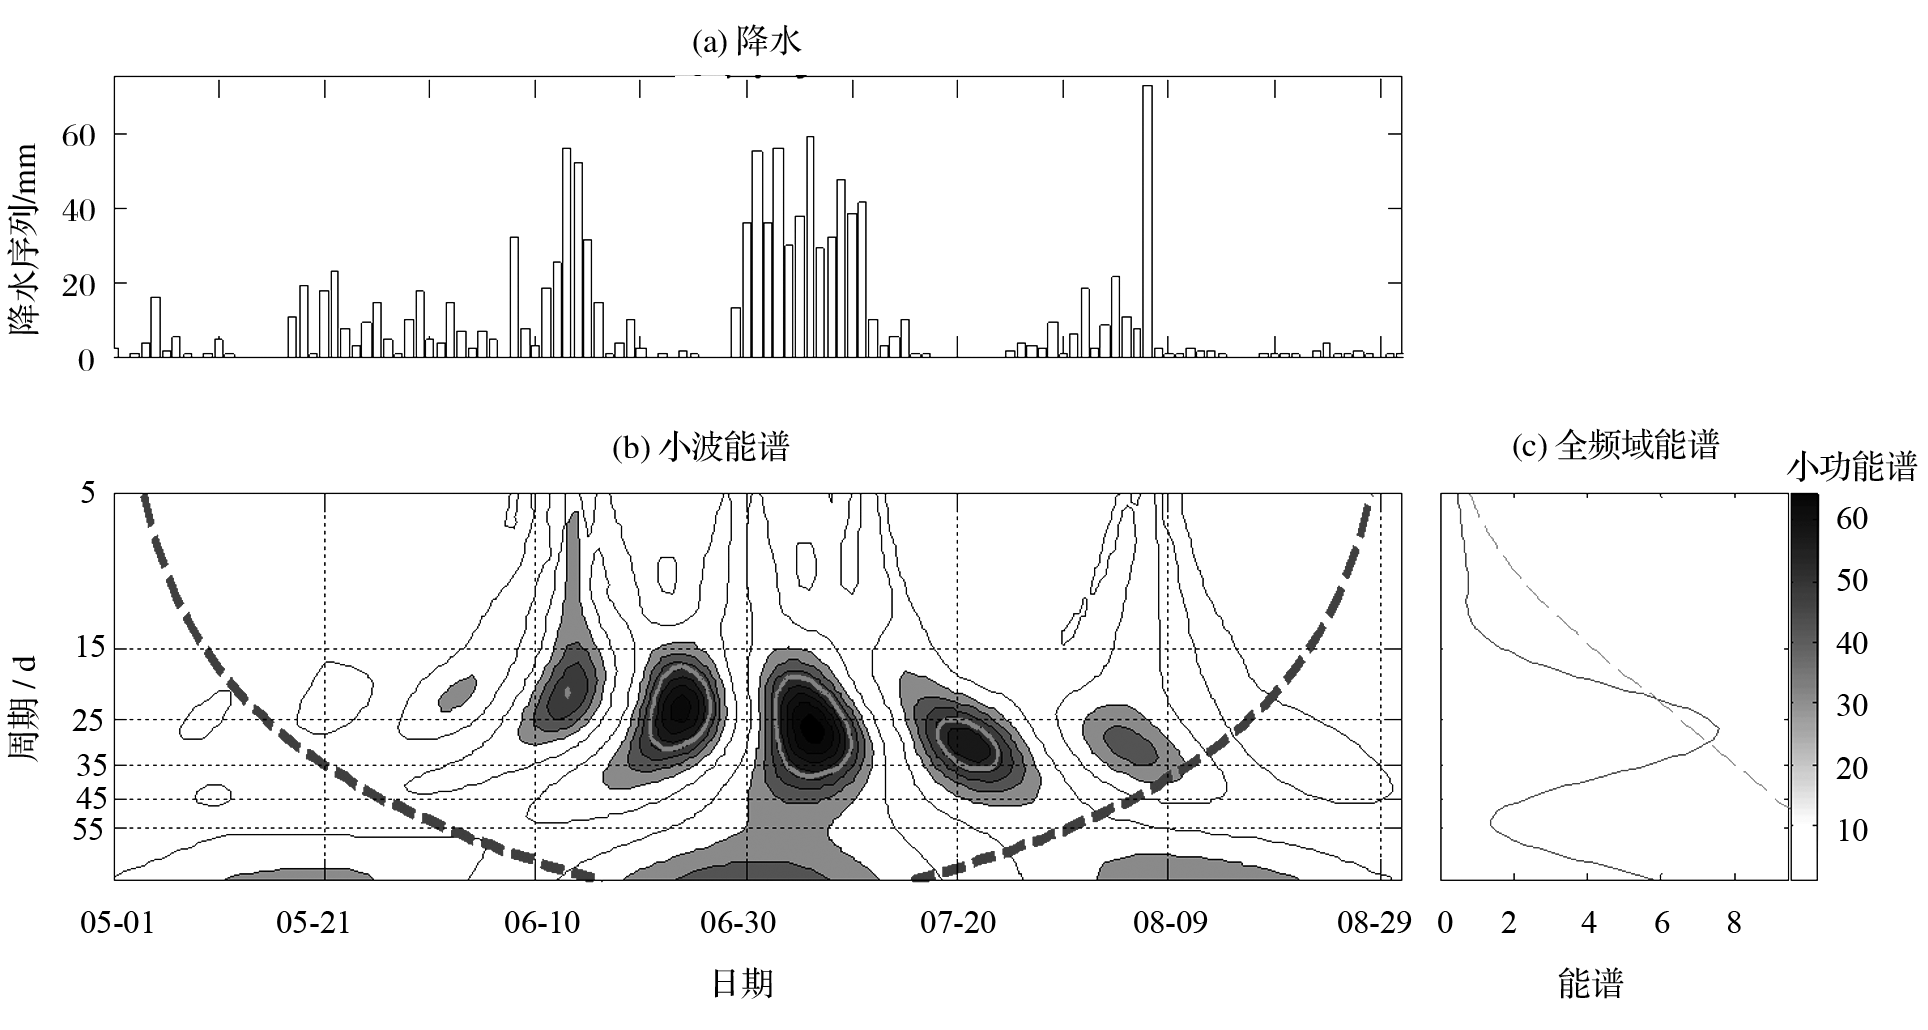
, Ni Yunqi, Chen Yang Fig.2 Wavelet analysis of precipitation of Yangtze River 28#cod#x000b0;~32#cod#x000b0;N, 115#cod#x000b0;~122#cod#x000b0;E in 1991 a Displays the regional averaged precipitation unit: mm; b Represents the wavelet power spectrum of precipitation, areas surrounded by bold contours denote that the power exceed 95% confidence level; the dashed lines indicate the region under the edge effects;c Shows the global wavelet spectrum, with dashed line indicating the red noise spectrum at the 95% confidence level